-1.png?height=120&name=CitNOWGroup_endorsed-branding_social-profile_Web1on1_square%20(3)-1.png)
In this article we will explain how to use the dashboard, export reports and calculate your MEC potential
Go straight to:
Loading the dashboard when working with the Edge browser
When using Microsoft Edge you will have to disable the tracking protection to be able to see the dashboard.
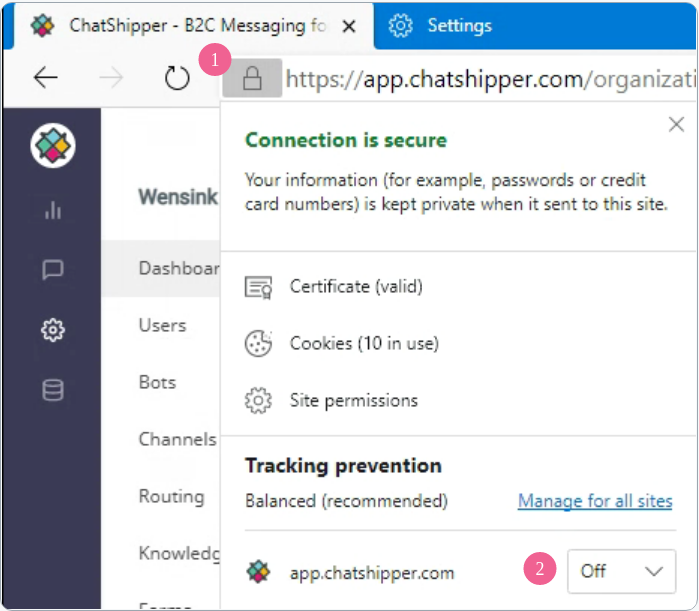
When on the Web1on1 website, click on the lock next to the URL (1), then turn off the tracking protection (2). After that, reload the page and the dashboards should load.
Disable your Adblocker
The dashboard can be prone to Adblocker issues, therefore it is advised to disable your Adblocker when you don't see any data on your dashboard.
Tip: If you don't want to disable your Adblocker, you can also add the page to your Whitelist
Exporting reports to CSV / Excel
Exporting a report to CSV/Excel can be done by right-clicking on a report and choose 1 of these options
-
Download to CSV
-
Download to CSV (Excel)
-
Download to google spreadsheet
Exporting to CSV/Excel is only possible when logged in to a Google account.
Doing more with Analytics & Data
Insight leads to more questions, leading to more dashboards. It's impossible to answer every question with a dashboard, but we still want to cater to your needs. And that's why we have an advanced API solution to pull the data you need.
1. The do-it-yourself option - Web1on1 Metrics API
Retrieve data from the Automotive Messaging Platform and use it for your business via our Metrics API. You will be able to integrate messaging data into your own reporting via popular BI tools like Google Data Studio, Tableau, PowerBI and others.
See our Developers Guide or jump straight to Metrics API documentation.
The Metrics API is documented at the developer's site, and works using the same API credentials as other endpoints.
It consists of a basic "snapshot" endpoint, that is also used to display the dashboards numbers.
For advanced metrics, we expose a cube.js REST API https://cube.dev/docs/rest-api
The API reference contains more info on the endpoints https://api.web1on1.chat/#metrics
2. Let us help you - Web1on1 BI-Experts custom dashboard requests
Web1on1 BI-Experts are available to built custom reports, following this process:
-
You send us a short brief about which data (or better: insights) you want to retrieve and how we should visualize this;
-
Web1on1 BI Expert will review your request.
-
We will set up a meet to align expectations (a BI-Expert will be involved).
-
If all is well, Web1on1 will send you a quotation based on the agreed specifications. The quotation will include an estimated number of hours for development (including one review round) and a monthly fee for dashboard maintenance and subscriptions (database / BI tooling).
-
You agree on the quotation and Web1on1 will send you the delivery time.
Need help? Contact our Support Team via our Help Center Chatbot